Explore the buying power of the US dollar from 1913 to 2026
Join our mailing list and get access to tools and insights that will help you:
Join 10,000+ Financially Savvy Readers Who are Taking Control of Their Money
We respect your privacy. We never share or sell your email to third parties. By providing your email, you opt into our marketing emails.
Inflation is the rate at which prices for goods and services go up over time. When inflation rises, every dollar you have buys a little less than it did before. A gallon of milk, a tank of gas, a month of rent -- they all cost more as inflation pushes prices higher.
A small amount of inflation is normal. The Federal Reserve targets about 2% per year, which signals a healthy, growing economy. But when inflation jumps above that -- like the 9.1% spike in June 2022 -- it starts to hurt. Your paycheck stays the same, but everything costs more.
The most common way to measure inflation in the United States is the Consumer Price Index (CPI), published monthly by the Bureau of Labor Statistics. The CPI tracks the price of a "basket" of common goods and services -- food, housing, transportation, medical care, clothing, and more -- and compares it month over month and year over year.
To put it bluntly: a dollar in 2026 buys about 97% less than a dollar in 1913. That means $1 in 1913 had the same buying power as roughly $33 today.
Here are a few examples that show just how dramatically prices have changed:
These are not small changes. Over long periods, even "mild" inflation of 2-3% per year compounds into massive price increases. That is why understanding inflation matters for anyone trying to save money, plan for retirement, or simply keep up with the cost of living.
Inflation does not have a single cause. It usually results from a combination of factors working together:
Inflation in the United States has not been steady. There have been dramatic swings over the past century:
If your savings account earns 1% interest but inflation is running at 3%, you are losing 2% of your purchasing power every year. Over a decade, that adds up significantly. A $10,000 savings balance effectively becomes worth about $8,200 in purchasing power after 10 years of 2% real loss.
Even if you get a raise, it might not keep up with inflation. If your salary goes up 3% but prices go up 4%, you are actually earning less in real terms than you were before the raise. This is called a decline in "real wages."
If you are planning to retire in 20-30 years, inflation will significantly change how much money you need. At 3% inflation, prices roughly double every 24 years. That means if you need $50,000 per year to live comfortably today, you would need about $100,000 per year in 24 years just to maintain the same lifestyle.
Here is one area where inflation actually helps. If you locked in a 3% mortgage before inflation jumped, you are now repaying that loan with dollars that are worth less than when you borrowed them. Your monthly payment stays the same, but in real terms, it costs you less each year.
The flip side: when the Fed raises interest rates to fight inflation, variable-rate debt (credit cards, adjustable-rate mortgages, HELOCs) gets more expensive. Credit card interest rates have climbed above 20% in recent years as a direct result.
You cannot stop inflation, but you can make sure your money keeps pace with it:
This calculator uses official CPI data from the Bureau of Labor Statistics to show you exactly how inflation has changed the value of the US dollar between any two years from 1913 to 2026.
You can also toggle on the chart view to see inflation trends visually, or check the examples panel to see what your money could buy in each time period.
Try it with your own salary, savings balance, or the price of something you bought years ago. The results are often surprising.
As of March 2026, the annual inflation rate is 3.3%, based on the Consumer Price Index (CPI-U) published by the Bureau of Labor Statistics. This means prices are rising at a moderate pace, above the Federal Reserve's 2% target but well below the 9.1% peak seen in June 2022.
A dollar in 2000 has the same buying power as about $1.87 in 2026. Put another way, you would need $187 today to buy what $100 could purchase in 2000. That represents a cumulative inflation of about 87% over 26 years.
Inflation is the general concept of prices going up over time. The CPI (Consumer Price Index) is the specific measurement tool used to track it. The BLS measures the CPI by tracking the prices of a representative basket of goods and services that typical consumers buy. When people say "inflation is 3%," they usually mean the CPI increased 3% over the past 12 months.
No. Inflation hits different people differently depending on what they spend money on and how much they earn. People who spend a larger share of their income on food, gas, and rent feel inflation more acutely because those categories tend to rise faster. Higher-income earners who own assets like stocks and real estate may actually benefit, since asset prices often rise with inflation.
The Federal Reserve's primary tool is the federal funds rate -- the interest rate banks charge each other for overnight loans. When the Fed raises this rate, borrowing becomes more expensive across the economy. Mortgages, car loans, and credit card rates all go up, which slows spending and reduces demand. Lower demand eventually brings prices down. The Fed raised rates aggressively from 2022-2023 to combat post-pandemic inflation, bringing the rate from near zero to over 5%.
Yes. A small, predictable amount of inflation (around 2% per year) is considered healthy because it encourages people to spend and invest rather than hoard cash. It also makes it easier for businesses to adjust wages and for the economy to absorb shocks. Deflation (falling prices) is actually more dangerous because it discourages spending and can lead to economic stagnation.
Balance Pro makes it easy to budget and track your personal finance, so you always know where your money is going.
Get Started 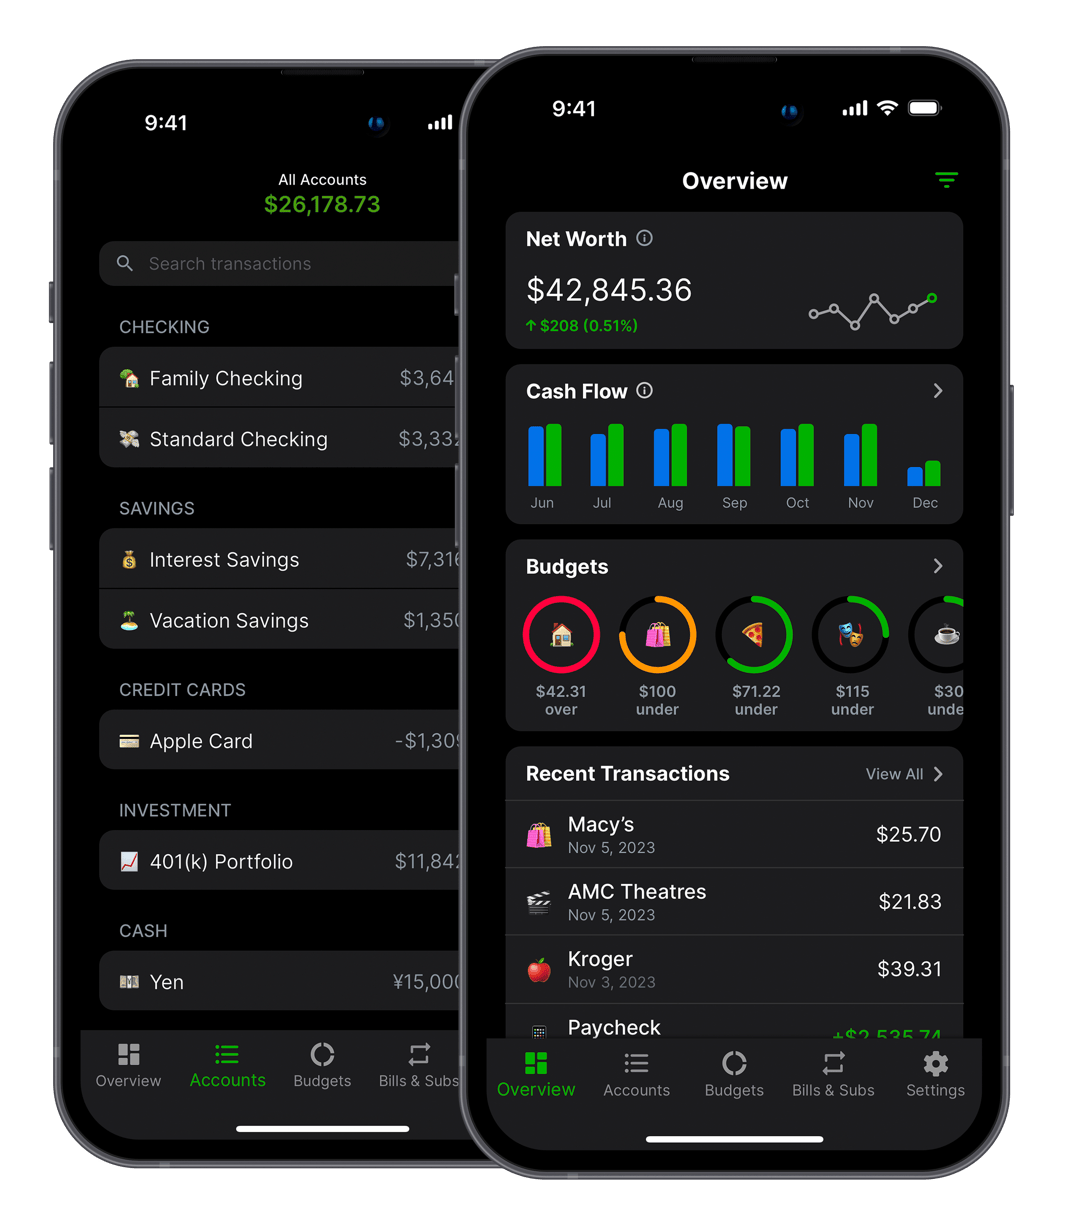
Balance Pro is a budgeting and personal finance app that helps you manage and optimize your money. Built by Jordan Kennedy in Nashville.
Download
Also from this developer
GrowthMap
GrowthMap is a tool that generates actionable growth reports for indie developers and solo founders.
Limelight
Never wonder what to watch again. Discover, track, and enjoy the best movies and shows.
Trivia Party
Trivia Party is a quiz game with over 12,000 questions across a variety of fun categories.
